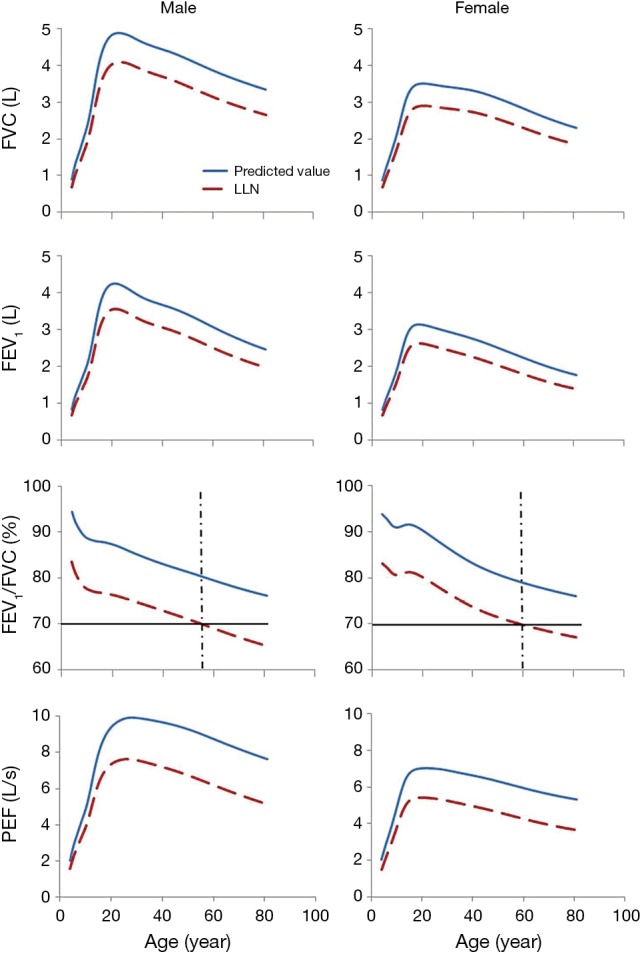
Figure 5.

Predicted values and LLNs in males and females for FVC, FEV1, FEV1/FVC%, PEF, respectively. Graphs were generated using mean height for age in the present study. LLNs, lower limits of normal; FEV1, forced expiratory volume in 1 second; FVC, forced vital capacity; PEF, peak expiratory flow.
