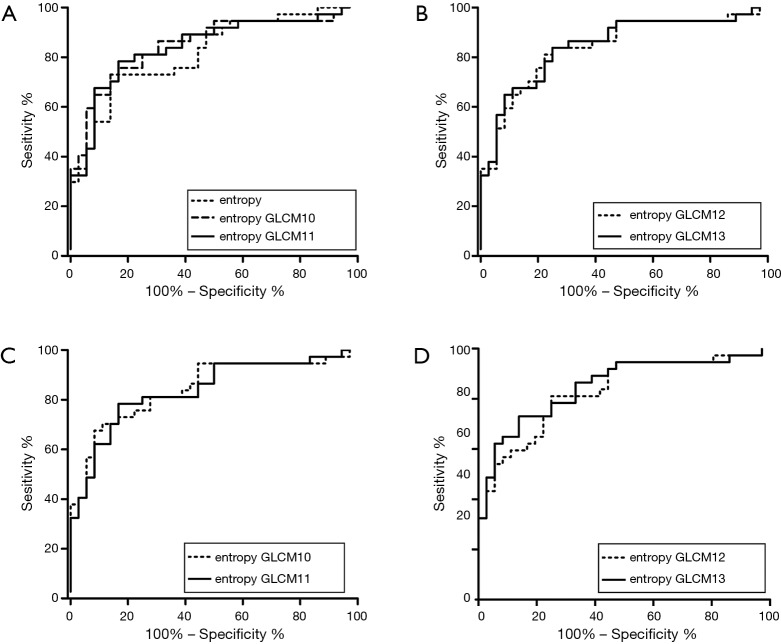
Figure 3.
ROC curves of texture parameters derived from CT images in differentiating different pathological characteristics of ESCCs. (A) ROC curves of kurtosis and entropy based on unenhanced CT images in differentiating different T stages (T1−2 vs. T3−4), with an AUC of 0.652 and 0.653, respectively; (B) ROC curve of entropy based on contrast enhanced CT images differentiating different T stages (T1−2 vs. T3−4) with an AUC of 0.637; (C) ROC curve of entropy based on contrast enhanced CT images in differentiating lymph node metastasis (N− vs. N+) with an AUC of 0.815; (D) ROC curves of kurtosis based on unenhanced CT images and entropy based on contrast enhanced CT images in differentiating overall stages (I/II vs. III/IV) with an AUC of 0.744 and 0.778, respectively. ROC, receiver operating characteristic; ESCC, esophageal squamous cell carcinoma; AUC, area under curve.

