
Figure 1.
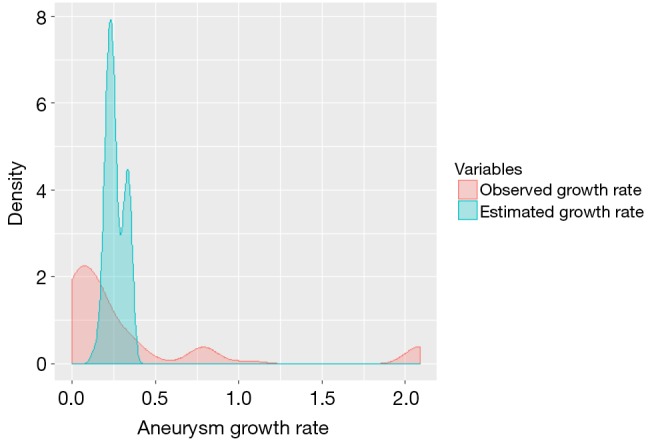
Growth distribution curve of the aortic root in Marfan syndrome patients. Observed growth rates are shown under the red curve, while the statistically estimated growth rates are shown under the blue curve. The mean aneurysm size from the data (4.5 cm) is different from the mean aneurysm size in the figure since the latter is obtained from the regression analysis.