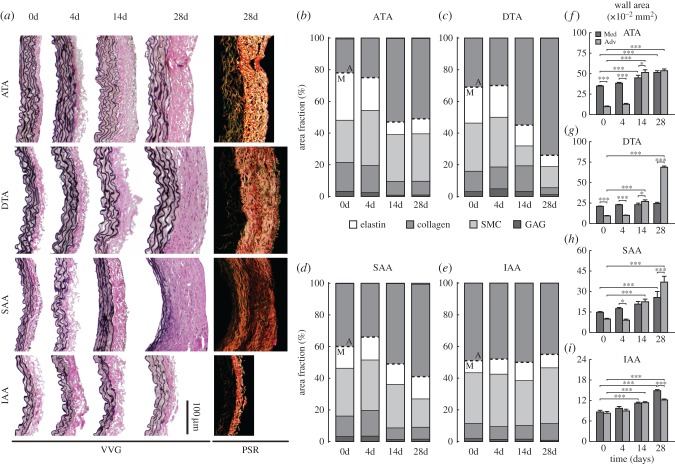
Figure 2.
Spatio-temporal differences in wall composition and structure. (a) Representative VVG stained histological sections show wall thickness and elastin (black) from four aortic regions (ATA, DTA, SAA, IAA) at four times throughout AngII infusion: baseline (0 days), 4, 14 and 28 days. PSR staining at 28 days reveals excessive adventitial collagen deposition in three of the four regions, but especially the DTA. Quantification of layer-specific (medial—M, below dashed line and adventitial—A, above dashed line) constituent area fractions–elastin (white), collagen (medium grey), smooth muscle (SMC; light grey) and glycosaminoglycans (GAG; dark grey)—are shown for the (b) ATA, (c) DTA, (d) SAA and (e) IAA. Despite differences in elastin, collagen and SMCs, changes in GAGs were unremarkable. (f–i) Layer-specific values (mean ± s.e.m.) for cross-sectional areas from the same four regions and times are delineated for the media (dark grey) and adventitia (medium grey) (n = 10 images per group). The adventitial percentage and area increased by 28 days in all regions except the IAA. Overbar denotes statistical significance between groups, where *, **, ***p < 0.05, 0.01, 0.001. Values for all metrics are in electronic supplementary material, tables S4 and S5.

