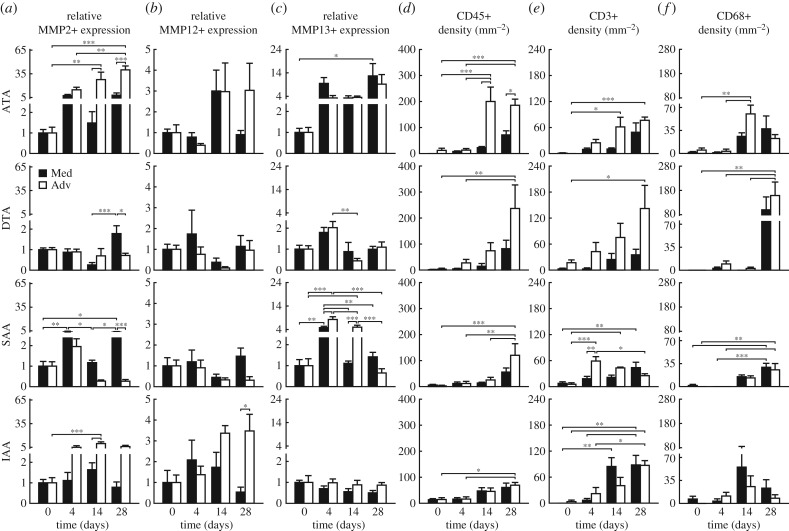
Figure 3.
Spatio-temporal differences in matrix metalloproteinases and inflammatory cells. Mean ± s.e.m. values, relative to baseline, for (a) MMP-2, (b) MMP-12 and (c) MMP-13 expression, and (d) CD45+, (e) CD3+, and (f) CD68+ cell density (per mm2) from four aortic regions at four times throughout AngII infusion: baseline (0 days), 4, 14 and 28 days (n = 6 images per group). Layer-specific content is reported separately for the media (black bar) and adventitia (white bar). Overbar denotes statistical significance between groups, where *, **, ***p < 0.05, 0.01, 0.001. Values for all metrics are in electronic supplementary material, table S5.

