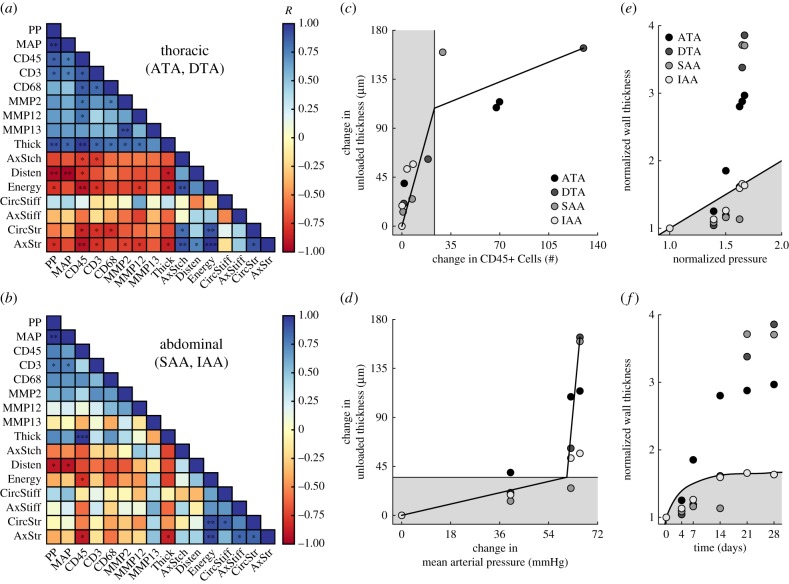
Figure 4.
Mechano-inflammatory correlates reveal a distinct time course of remodelling. Heat maps of the Pearson correlation coefficient R for pooled (a) thoracic and (b) abdominal segments (n = 8 points per correlation); blue indicates a positive and red a negative correlation. Piecewise linear fitting of the change in wall thickness versus the change in (c) CD45+ cells or (d) mean arterial pressure for all regions and times reveals an early mechano-mediated remodelling (grey region) followed by a later inflammatory-mediated remodelling (white region). Mechanoadaptation is defined by a linear relationship between normalized changes in pressure and wall thickness (i.e.  [21]. The time course of thickness adaptation should, therefore, mimic the nearly logarithmic behaviour of the pressure increase (cf. electronic supplementary material, figure S1). (e) Pressure- and (f) time-dependent thickness adaptation was achieved by the IAA alone (light grey circles). Data off the line of identity (black line in e), or the line of adaptation (black curve in f), indicate areas of either progressively adaptive (
 ; grey) or maladaptive (
 ; white) remodelling. Statistical significance (in a and b) is denoted by *, **, ***p < 0.05, 0.01, 0.001. All correlation coefficients and p-values are in electronic supplementary material, tables S6A–N.

