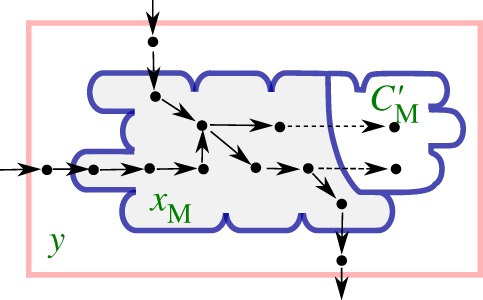
Figure 3.

Population of cells growing in a bioreactor with metabolic reactions that involve free metabolites with concentrations xM and metabolites incorporated into biomass with masses C′M. The dots represent the molecular constituents and the arrows biochemical reactions. The dashed reactions represent the incorporation of free metabolites into the biomass. This extended system is described by modifying equations (5.4)–(5.7) with new expressions for the steady-state dynamics of the metabolic network (equation (6.5)) and the growth rate (equation (6.1)).
