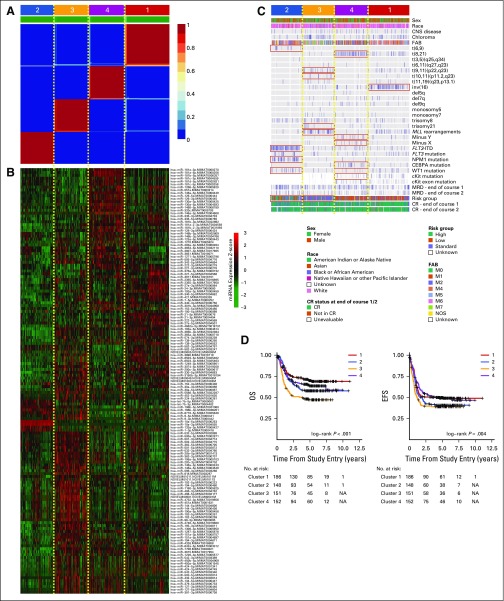
Fig 2.
Unsupervised non-negative matrix factorization (NMF) clustering of miRNA expression profiles of primary samples. (A) NMF consensus map for k = 4 subgroups. Deep red blocks numbered 1 to 4 indicate four subgroups that were identified by using NMF. (B) Heat map displaying the expression of miRNAs that are significantly differentially expressed between subgroups (P < .05, Wilcoxon test proportional hazards regression adjusted; log2 fold change > 1). (C) Covariate tracks displaying the clinical attributes of each patient. Red boxes indicate clinical attributes that enrich one cluster over the others (P < .01, Fisher’s exact test). (D) Kaplan-Meier plots illustrating overall survival (OS) and event-free survival (EFS) status of patients in each subgroup. CR, completed response; FAB, French-American-British; ITD, internal tandem duplication; MRD, minimal residual disease; NA, not applicable.

