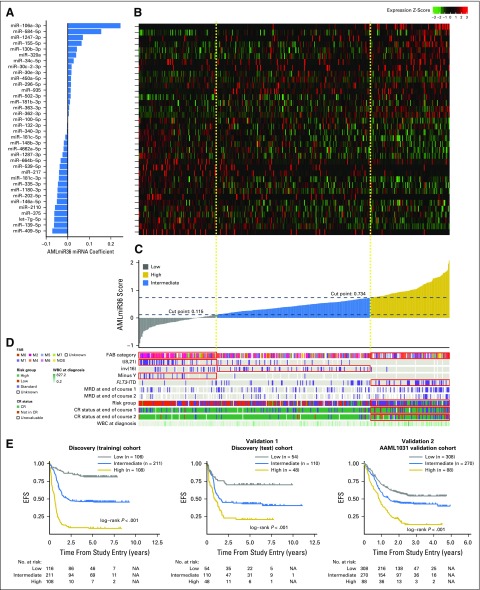
Fig 3.
miRNA-based event-free survival (EFS) predictive model. (A) Predictor equation coefficients of the 36 miRNA features in the EFS prognostic model. (B) Heat map of relative expression levels of miRNA features across samples in the discovery (training) cohort (n = 425). (C) Model scores of each patient in the discovery (training) cohort derived using the EFS prognostic model. (D) Covariate tracks displaying the clinical attributes of each patient. Red boxes indicate that the model score group is enriched for the indicated attribute (P < .01, Fisher’s exact test). (E) Kaplan-Meier plots displaying EFS differences between patients in various—low, intermediate, and high—model score groups within the discovery (training) cohort (n = 425), the discovery (test) cohort (n = 212), and the AAML1031 validation cohort (n = 666). Patients with high model scores had the poorest outcomes, whereas patients with low model scores had superior outcomes. Cox proportional hazards regression ratios are listed in Table 2. CR, completed response; FAB, French-American-British; ITD, internal tandem duplication; MRD, minimal residual disease; NA, not applicable.

