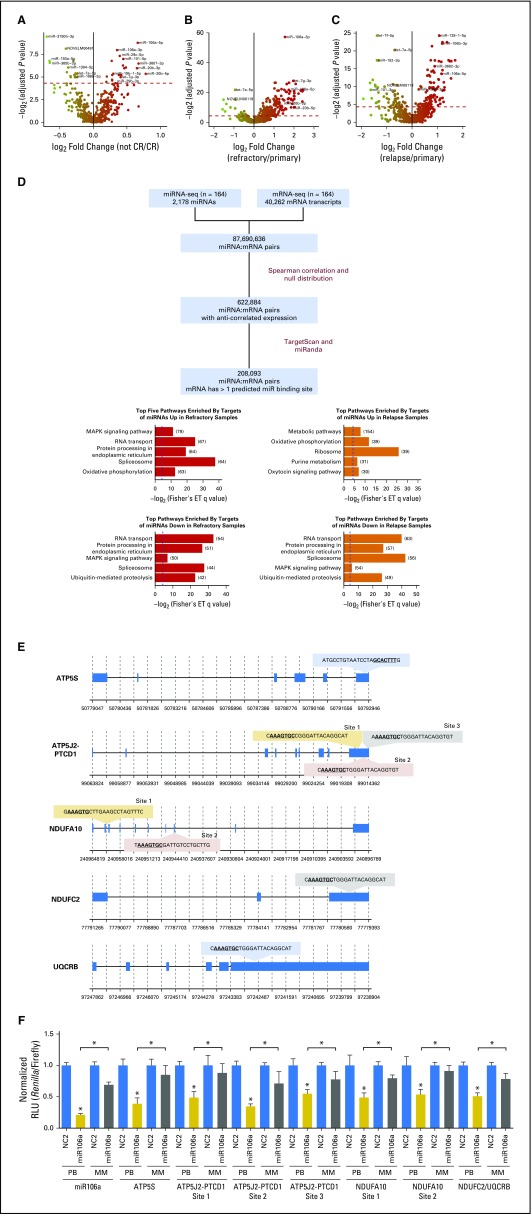
Fig 4.
Integrative miRNA:mRNA analysis to identify putative targets of miRNAs. (A-C) Volcano plots displaying differentially expressed miRNAs (A) between primary samples from patients with refractory disease and primary samples from patients who achieved complete response; (B) between refractory samples and primary samples; and (C) between relapse and primary samples. Red dotted line represents the significant differential expression threshold (q < 0.05). (D) Workflow for miRNA:mRNA integrative analysis. Putative miRNA targets are those mRNA with expression patterns that are not correlated with the expression of their targeting miRNA and that harbor at least one predicted binding site for the targeting miRNA (left). Top five KEGG pathways enriched by targets of miRNAs that are significantly differentially expressed (right). The numbers of target genes that fall into each pathway are indicated in brackets. Blue dotted lines indicate the q value significance threshold, set at 0.05. (E) miR-106a-5p binding sites predicted by both TargetScan and miRanda on candidate target genes that are involved in oxidative phosphorylation: ATP5S, ATP5J2-PTCD1, NDUFA10, NDUFC2, and UQCRB. (F) miR-106a-5p activity in HEK-293 cells was assessed by using a psiCHECK2 dual luciferase reporter construct that contained each of the putative ATP5S, ATP5J2-PTCD1, NDUFA10, or NDUFC2/UQCRB binding sites. Activity is measured as Renilla luminescence normalized to Firefly luminescence to control for transfection efficiencies. Data are shown as normalized relative luciferase units (RLU) with respect to the corresponding dose of the control mimic and are representative of three independent experiments (means ± SEM). Statistically significant comparisons between the cotransfected miR-106a-5p miRNA (20 pmol) and the NC2 control for the perfect binding reporter vector are noted over the solid colored bars. Statistical significance between perfect binding and mismatch constructs are indicated above the comparisons. *P < 0.05. White bars: NC2 negative control mimics; solid gray bars: miR-106a-5p mimics on perfect binding (PB) sites; striped gray bars: mir-106a-5p mimics on mismatched (MM) sites. ET, Fisher’s exact test; MAPK, mitogen-activated protein kinase; seq, sequencing.

