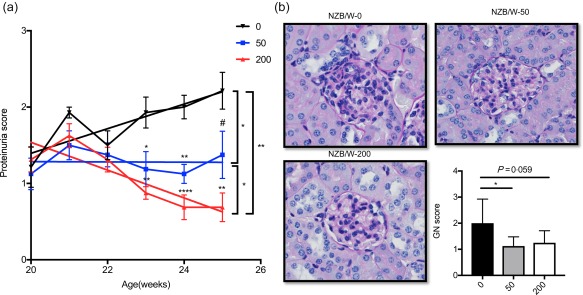
Figure 1.

Inhibition of histone deacetylase (HDA)C6 prevents histone deacetylase (LN) progression. (a) New Zealand Black/White (NZB/W) mice showing proteinuria as they age. The tendency of proteinuria changes in three groups are indicated by the slope of lines representatively. 0 = control; 50 (mg/kg ACY‐738); 200 (mg/kg ACY‐738). (b) Representative periodic acid‐Schiff (PAS) image of the glomerulus from NZB/W mice in three different group are shown along with pathology score for glomerular lymphoproliferative mononuclear cell infiltration. Data are shown as mean ± standard error of the mean (s.e.m.), n = 8 mice in each group, #P = 0·057; *P < 0·05; **P < 0·01; ***P < 0·001; one‐way analysis of variance (anova). [Colour figure can be viewed at wileyonlinelibrary.com]
