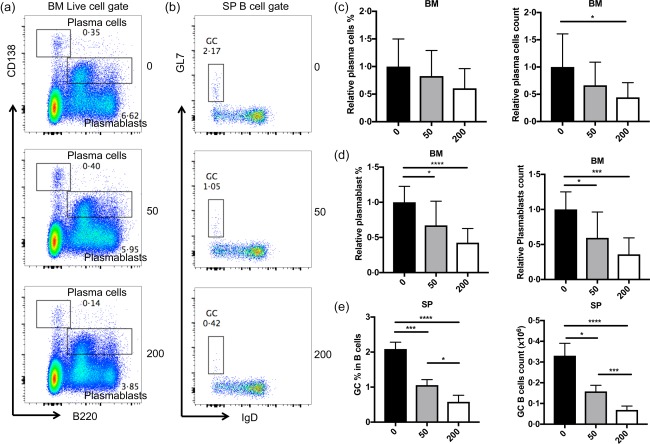
Figure 4.

Histone deacetylase (HDA)C6 inhibition decreases B cell responses. (a) Representative flow cytometry plots for plasma cells and plasmablasts in the bone marrow. (c,d) Graphical representation of the relative percentage and absolute cell count of plasma cells and plasmablasts in the bone marrow. (b) Representative flow cytometry plots of B cells of germinal centre in the spleen. (e) Graphical representation of relative percentage and absolute cell numbers of B cells of germinal centre in the spleen. Representative flow cytometry plots are shown. *P < 0·05; ***P < 0·001; one‐way analysis of variance (anova); n ≥ 4. [Colour figure can be viewed at wileyonlinelibrary.com]
