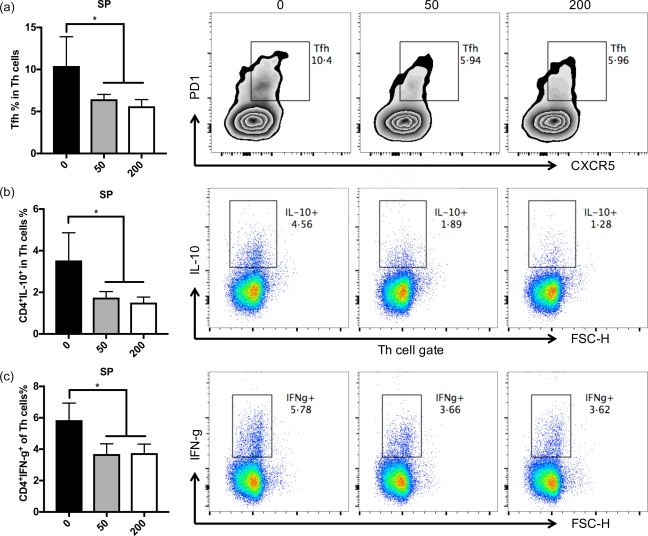
Figure 5.

Histone deacetylase (HDA)C6 inhibition reduces pathogenic T cell responses. (a) Graphical representation and histogram of the percentage of follicular T cells in total T helper cells in the spleen in New Zealand Black/White (NZB/W) mice treated with different doses of ACY‐783. (b) Graphical representation and histogram of the percentage of interleukin (IL)‐10‐secreting cells in total CD4+ T helper cells in the spleen of NZB/W mice treated with different doses of ACY‐783. (c) Graphical representation and histogram showing percentage of interferon (IFN)‐γ‐secreting cells in total CD4+ T helper cells in the spleen of NZB/W mice treated with different doses of ACY‐783. *P < 0·05; **P < 0·01; one‐way analysis of variance (anova). Representative images are shown; n = 4. [Colour figure can be viewed at wileyonlinelibrary.com]
