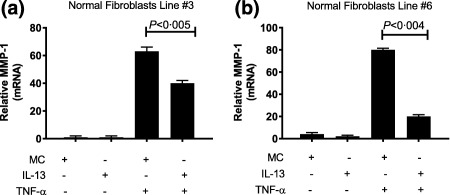
Figure 3.

Expression of matrix metalloproteinase‐1 (MMP‐1). Polymerase chain reaction (PCR) analyses of MMP‐1 mRNA in dermal fibroblasts after a 14‐day culture with recombinant interleukin (IL)‐13 followed by stimulation with tumour necrosis factor (TNF)‐α in normal dermal fibroblast lines 3 (a) and 6 (b). Data are expressed as standard error of the mean (s.e.m.) and plotted as relative MMP‐1. P‐values were determined by analysis of variance (anova) and compared with the value in TNF‐α‐treated cells.
