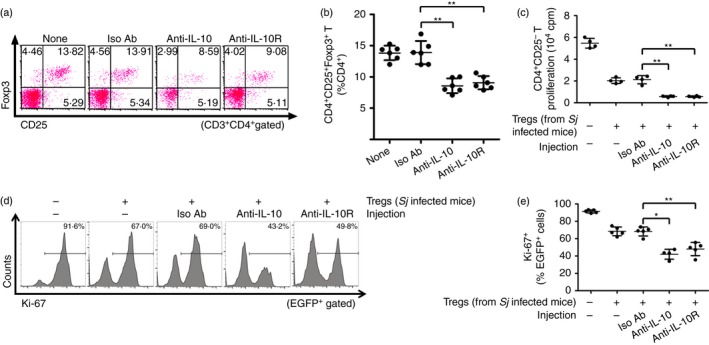
Figure 4.

Injection of anti‐interleukin‐10 (IL‐10) or anti‐interleukin‐10 receptor (IL‐10R) decreased the frequencies but enhanced the immunosuppressive activity of regulatory T (Treg) cells in Schistosoma japonicum‐infected mice. (a) S. japonicum‐infected mice (n = 6 per group) were injected intraperitoneally with anti‐IL‐10, anti‐IL‐10R or rat IgG1 isotype control antibody as described in the Materials and methods. Splenocytes were then isolated and stained with PerCP‐Cy5.5 anti‐CD3, FITC anti‐CD4, APC anti‐CD25, and PE anti‐Foxp3. FCM dot plots of CD25+ Foxp3+ Treg cells gated on CD3+ CD4+ T cells are shown. (b) Scatter plot shows the average percentages of CD4+ CD25+ Foxp3+ Treg cells in CD4+ T cells. (c) Normal mice derived CD4+ CD25− T cells (1 × 10⁵ cells/well) and antigen‐presenting cells (1 × 10⁵ cells/well) were stimulated with anti‐CD3 (2 μg/ml) in the absence or presence of CD4+ CD25+ Treg cells (1 × 10⁵ cells/well) from anti‐IL‐10, anti‐IL‐10R or isotype control antibodies injected into S. japonicum‐infected mice at 37° or 72 hr (n = 4 per group). The proliferation was measured by incorporation of [3H]thymidine. (d, e) CD4+ CD25− T cells from EGFP‐Tg mice and CD4+ CD25+ Treg cells from S. japonicum‐infected mice injected with anti‐IL‐10, anti‐IL‐10R or isotype control antibodies were co‐cultured as described in (c) (n = 4~5 per group). The suppressive activity of Treg cells on CD4+ CD25− T cells was measured by analysing the expression of Ki‐67 in EGFP + cells (CD4+ CD25− T cells). Histogram profiles of Ki‐67 gated on EGFP + cells are shown. Scatter plot shows the average percentages of Ki‐67+ cells in EGFP + cells. Each assay has been performed three times on independent cell samples. Flow cytometry dot plots or histograms are representative of three independent experiments. Data (mean ± SD) are representative of three independent experiments. *P < 0·05, **P < 0·01. [Colour figure can be viewed at wileyonlinelibrary.com]
