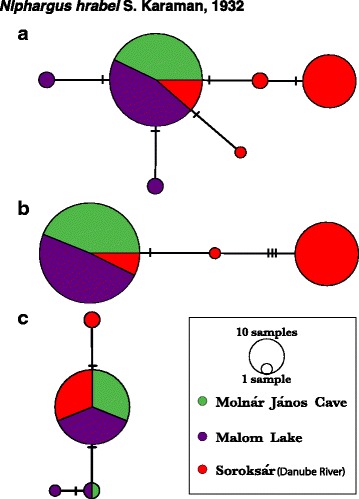
Fig. 5.

Haplotype networks of Niphargus hrabei: nuclear (a- ITS; b- NaK) and mitochondrial (c- 16S and COI) loci. Node diameter and annotation denote sample sizes (alleles in the case of nuclear genes), while hatch marks represent mutational steps between haplotypes. Colours represent sampling locality, as illustrated in the legend
