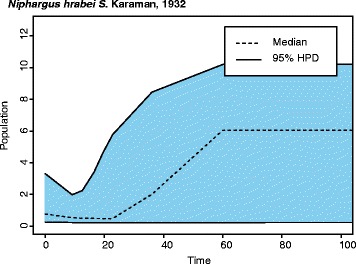
Fig. 8.

An Extended Bayesian Skyline Plot of Niphargus hrabei’s demographic history, from 100,000 years ago to today, depicts a possible genetic bottleneck at approximately 10,000 years ago. The x-axis represents time before present in thousands of years, while the y-axis denotes the estimated population size (θ) assuming a generation time of one year
