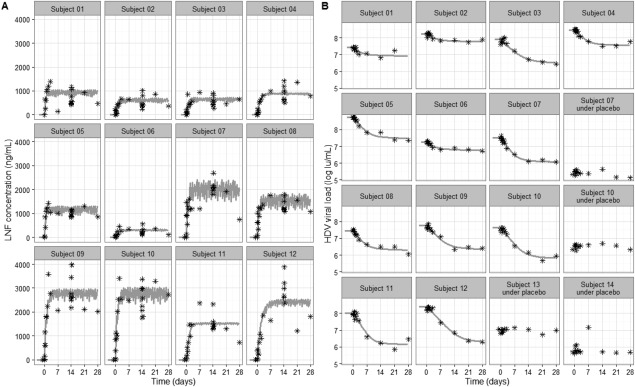
Figure 1.

Individual fits of LNF concentration and serum HDV. Each box represents a subject. The measured (A) LNF and (B) HDV RNA levels are shown with stars. Best model fit curves are shown by the gray solid lines. Subjects 01‐06 and subjects 07‐12 were dosed with LNF 100 mg bid and 200 mg bid, respectively. Subjects who received placebo are indicated in (B). Model predictions of LNF PK and HDV response per dosing group are shown in http://onlinelibrary.wiley.com/doi/10.1002/hep4.1043/suppinfo.
