
Figure 1.
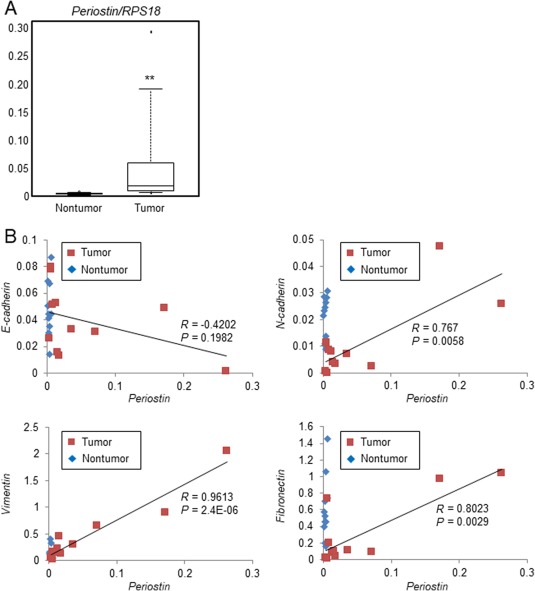
Expression levels of periostin and mesenchymal markers in ICC tissues. Surgical ICC tissues (n = 11) were subjected to real‐time PCR for the quantification of periostin and EMT‐related markers. (A) The gene expression of periostin was compared in ICC tissues and adjacent nontumor tissues. Data are shown as box plots that indicate the minimum, first quartile, median, third quartile, and maximum. Statistical comparisons were completed using a two‐sided paired Student t test; **P < 0.01. (B) Associations between the levels of periostin (x axis) and each EMT‐related marker (y axis) are shown in scatter plots. Abbreviation: RPS18, ribosomal protein S18.