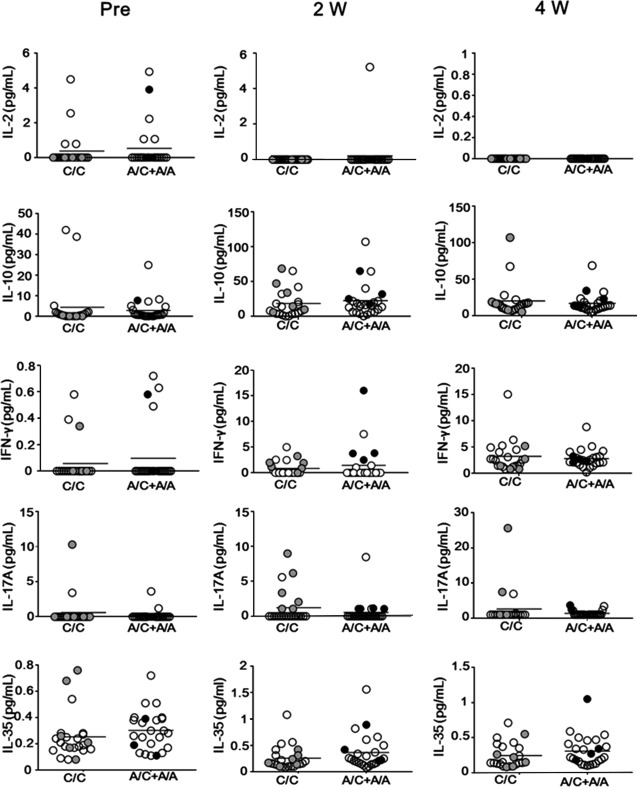
Figure 3.

rs3761548 A/C+A/A recipients show a higher level of IFN‐γ than patients with the C/C genotype. Serum levels of IL‐2, IL‐10, IFN‐γ, IL‐17A, and IL‐35 of LT recipients as quantified by cytometric bead assay or enzyme‐linked immunosorbent assay at pretransplant and 2 weeks and 4 weeks after transplantation among FOXP3 rs3761548 A/C genotypes. Open white circles represent no‐rejection patients (n = 38), gray round circles represent SSAR patients (n = 6), and black round circles represent SRAR patients (n = 4). Horizontal bars represent grand mean of each group.
