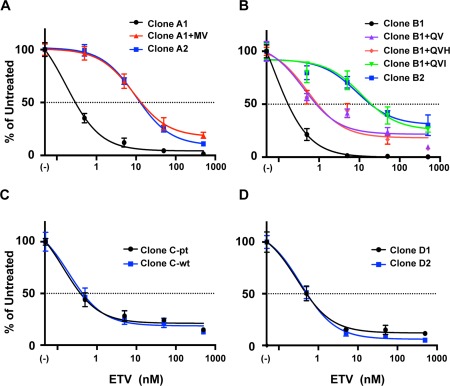
Figure 4.

Dose‐response curve analysis of susceptibilities of patient‐derived and identified mutation‐introduced HBV clones (A: Case A with VBT, B: Case B with VBT, C: Case C with partial virological response, D: Case D with flare‐up). The dose‐response curves were drawn with data obtained by real‐time PCR described in Fig. 3 and Supporting Fig. S2. The amount of core‐particle‐associated HBV DNA without ETV treatment was defined as the untreated control, and percentages of the amount of core‐particle‐associated HBV DNA at the indicated concentration of ETV were calculated. The results are shown as the means ± SD.
