Figure 2.

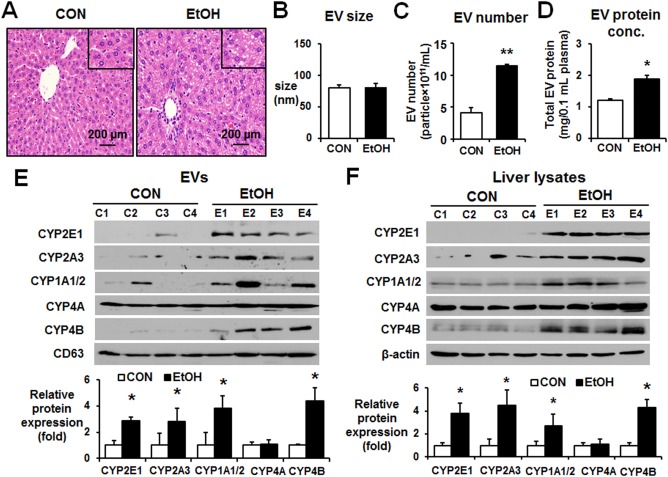
Binge alcohol increased the levels of P450 isoforms in circulating EVs in rats. (A) Representative hematoxylin and eosin staining of formalin‐fixed liver sections for the indicated groups (magnification ×100). The inset figures represent larger (×200) magnification images. (B) Analysis of the size of circulating EVs isolated from the control or binge ethanol‐exposed Fischer rats performed by Nanosight. (C) Total number of EVs in the control or binge ethanol‐exposure rats was measured by Nanosight. (D) Total protein amounts of EV derived from the control or binge ethanol‐exposure rats. (E) Detection of the cytochrome P450 proteins (e.g., CYP2E1, CYP2A3, CYP1A1/2, CYP4A, and CYP4B) in circulating EVs from the different groups by immunoblot analyses, as indicated. CD63 was used as a loading control for the same amounts of total EV proteins in all samples. Densitometric quantitation of the immunoblots for P450 isoforms relative to CD63 (n = 4/group) is shown. *P < 0.05. (F) Detection of the P450 proteins in liver lysates from the different groups by immunoblot analyses, as indicated. β‐Actin, used as a loading control, is shown. Densitometric quantitation of the immunoblots for CYP proteins relative to β‐actin (n = 4/group) is shown. *P < 0.05, **P < 0.01. Abbreviations: CON, control; EtOH, ethanol. Data are shown as means ± SD.
