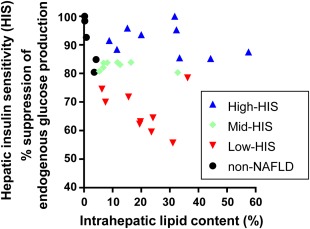
Figure 1.

Large variation in percent suppression of endogenous glucose production and intrahepatic lipid content. Patients with NAFLD with an intrahepatic lipid content >5% (n = 26) were divided into three groups ranked by the clamped percent suppression of endogenous glucose production. Upper one third, blue triangles indicate high‐HIS; middle one third, green diamonds indicate mid‐HIS; lower one third, red triangles indicate low‐HIS. Hepatic insulin sensitivity in the upper one third (blue triangles) was identical to that of non‐NAFLD subjects (black dots).
