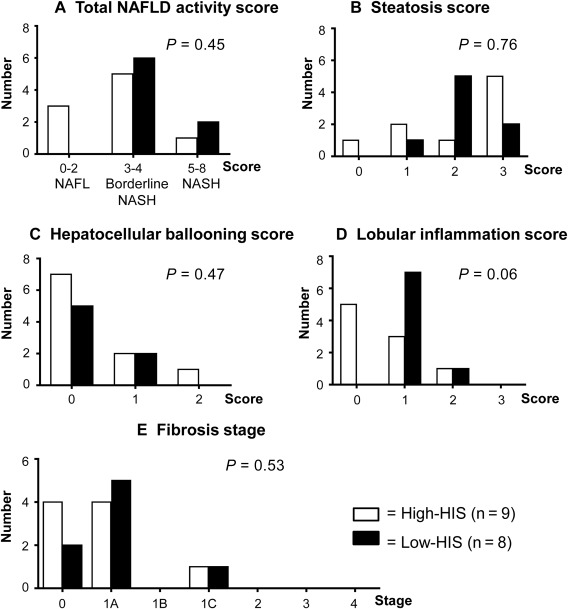
Figure 2.

Histopathologic comparison between high‐HIS and low‐HIS groups.
The NAFLD activity score was assessed by histologic features of steatosis (0‐3), lobular inflammation (0‐2), and hepatocellular ballooning (0‐2). (A) Total NAFLD activity score. (B) Steatosis score. (C) Hepatocellular ballooning score. (D) Lobular inflammation score. The total NAFLD activity score (A) was calculated by summation of the scores of B, C, and D. (E) Fibrosis stage was also assessed in addition to the NAFLD activity score. Data represent the number of patients for each score. Wilcoxon rank sum test was used for comparing the two groups.
