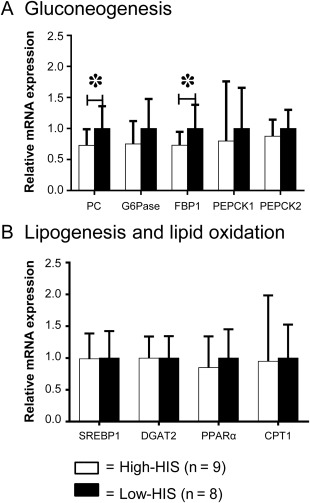
Figure 3.

Comparison of hepatic mRNA expression between high‐HIS and low‐HIS groups. (A) Gluconeogenesis. (B) Lipogenesis and lipid oxidation. The average values of the low‐HIS group were set as 1. Data are mean ± SD. *P < 0.05, by unpaired t test.
Abbreviations: CPT1, carnitine palmitoyltransferase I; DGAT2, diacylglycerol O‐acyltransferase 2; FBP1, fructose‐1,6‐bisphosphatase; G6Pase, glucose‐6‐phosphatase; PEPCK, phosphoenolpyruvate carboxykinase; PPARα, peroxisome proliferator‐activated receptor α; SREBP1, sterol regulatory element binding transcription factor 1.
