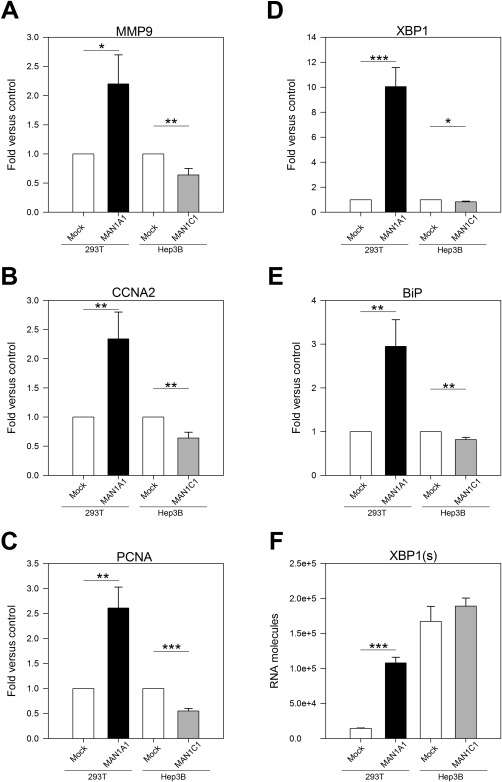
Figure 5.

Expression patterns of MMP9, CCNA2, PCNA, and UPR regulator in MAN1A1 or MAN1C1‐overexpressing stable cell lines. (A) Overexpression of MAN1A1 induced MMP9 expression to 2.3‐fold, whereas overexpression of MAN1C1 repressed MMP9 expression to 0.33‐fold compared to the DsRed control (Mock). (B) CCNA2 (cell cycle marker) was up‐regulated in MAN1A1‐overexpressing stable cells and down‐regulated in MAN1C1‐overexpressing cells. (C) PCNA (cell proliferation marker) was up‐regulated in MAN1A1‐overexpressing cells and down‐regulated in MAN1C1‐overexpressing cells. (D) MAN1A1‐overexpressing cells displayed significantly enhanced expression of XBP1, and MAN1C1‐overexpressing cells displayed down‐regulated expression of XBP1. (E) MAN1A1‐overexpressing cells displayed significantly enhanced expression of BiP, and MAN1C1‐overexpressing cells displayed down‐regulated expression of BiP. (F) MAN1A1‐overexpressing cells exhibited higher levels of spliced XBP1 mRNA than mock; however, MAN1C1 overexpression did not appear to decrease XBP1(s) expression. Statistical significance was calculated using the Student t test (*P < 0.05, **P < 0.01, ***P < 0.001). All figures are results of triplicate experiments.
