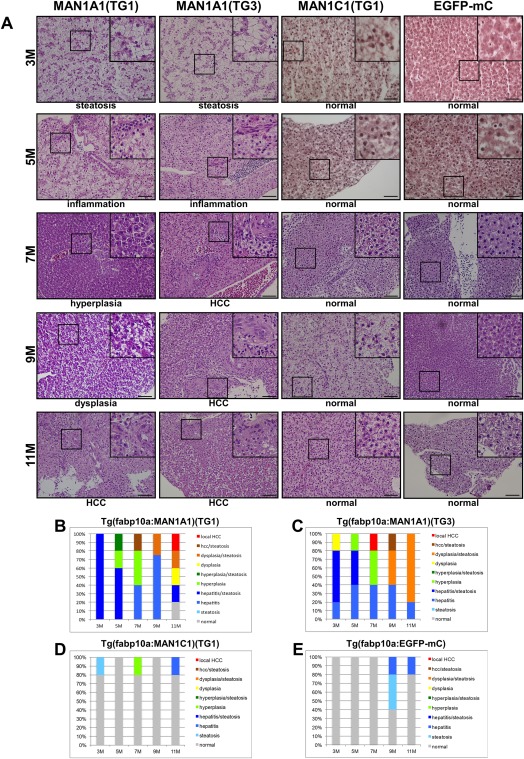
Figure 6.

Histopathological analysis of hepatocytes in MAN1A1 and MAN1C1 transgenic fish at 3, 5, 7, 9, and 11 months of age. (A) Hematoxylin and eosin staining of liver sections from the TG1 and TG3 independent lines of MAN1A1 and MAN1C1(TG1) transgenic fish. Hematoxylin and eosin staining of the liver sections from MAN1A1 transgenic fish showed various pathological features, such as steatosis, inflammation, hyperplasia, dysplasia, and HCC. The MAN1C1 transgenic fish and EGFP‐mCherry control fish revealed normal phenotypes. The images were taken at magnification ×400, and scale shown is for 30 μm. (B) Statistical analysis of MAN1A1 (TG1), (C) MAN1A1 (TG3), (D) MAN1C1 (TG1), and (E) Tg(fabp10a:EGFP‐mCherry) is shown; n = 5 for each stage of transgenic fish.
