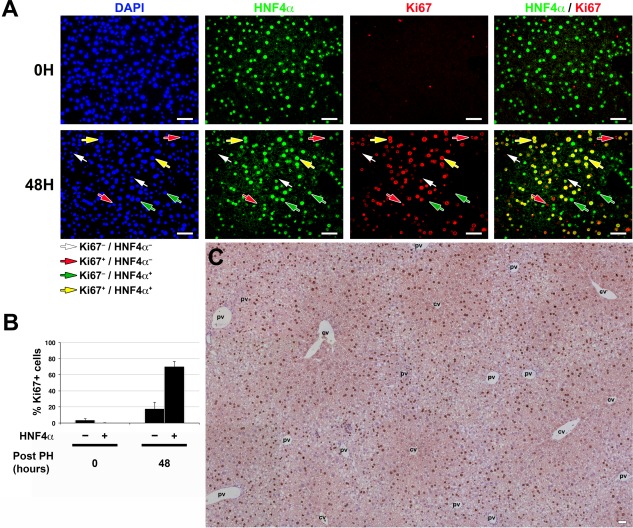
Figure 3.

Most hepatocytes participate in the cell‐cycle response after PH. (A) Immunofluorescence analysis of paraffin‐embedded sections of resting (0H) and 48 hours post‐PH (48H) livers stained with DAPI (blue), hepatocyte‐specific anti‐HNF4α (green), and proliferation‐specific anti‐Ki67 (red) antibodies. White arrows identify noncycling (Ki67–), and red arrows identify cycling (Ki67+) HNF4α– nonhepatocytes. Green arrows identify noncycling (Ki67–), and yellow arrows identify cycling (Ki67+) HNF4α+ hepatocytes. (B) Graph showing the percentage of cycling (Ki67+) nonhepatocytes (HNF4α–) and hepatocytes (HNF4α+) in resting (0 hour) compared to 48 hours post‐PH livers (n = 5 mice/time point). The difference between percentages of cycling (Ki67+) nonhepatocytes (HNF4α–) at 0 hour and 48 hours after PH was significant (P = 0.01). The difference between percentages of cycling (Ki67+) hepatocytes (HNF4α+) at 0 hour and 48 hours after PH was highly significant (P = 1.37 × 10⁻⁵). The difference between percentages of cycling (Ki67+) nonhepatocytes (HNF4α–) and hepatocytes (HNF4α+) at 48 hours after PH was highly significant (P = 3.02 × 10⁻⁶). Displayed values are mean ± SD. (C) DAB immunostaining for Ki67 (brown) together with nuclear Mayer's hematoxylin staining (blue) in paraffin‐embedded sections of 48 hours post‐PH liver. The image shown is a composite image of several overlapping fields. Scale bar, 50 μm for all. Abbreviations: cv, central vein; DAB, diaminobenzidine; DAPI, 4´,6‐diamidino‐2‐phenylindole; pv, portal vein.
