Figure 4.

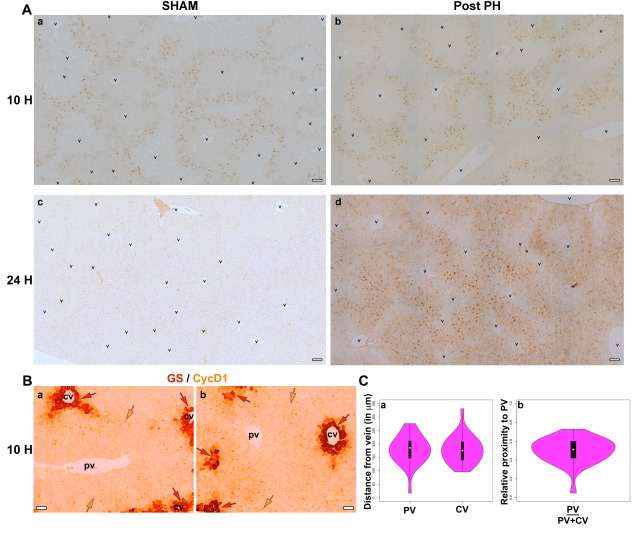
Midlobular hepatocytes show first response after PH. (A) DAB immunostaining for CycD1 (light brown) in paraffin‐embedded sections of (a) 10 hours post‐sham‐operation (10 H SHAM), (b) 10 hours post‐PH (10 H Post PH), (c) 24 hours post‐sham operation (24 H SHAM), and (d) 24 hours post‐PH (24 H Post PH) livers. (B) Two images of DAB immunostaining for CycD1 (light brown) together with DAB immunostaining for the GS pericentral‐hepatocyte marker (dark brownish‐red) in paraffin‐embedded sections of 10 hours post‐PH (10 H) liver are shown. The light brown arrows point to CycD1+ hepatocytes and dark brownish‐red arrows point to GS+ pericentral hepatocytes. (C) Violin plots showing the range of distal and proximal distances of the CycD1+ hepatocytes from either a PV or CV (n = 26). The relative proximity to PV was calculated by dividing the distance of a CycD1+ hepatocyte from its nearest PV by total distance between the surrounding PV and CV. Scale bar, 50 μm for all. Abbreviations: cv, central vein; DAB, diaminobenzidine; pv, portal vein.
