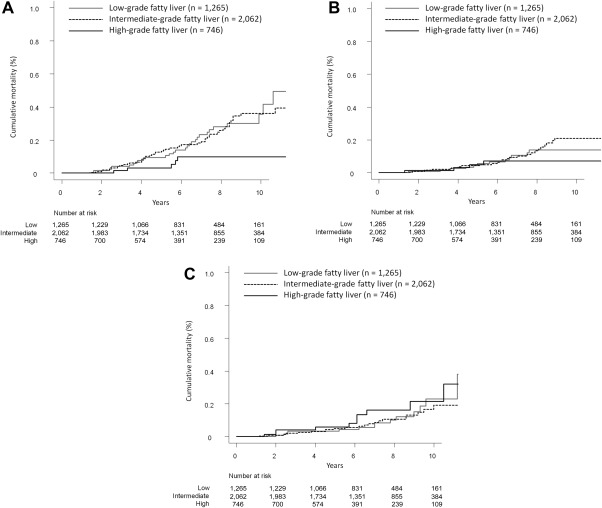
Figure 3.

Cumulative mortality from categorized non‐liver‐related diseases based on the severity of fatty liver. (A) Malignancies. The respective 3‐, 5‐, and 10‐year cumulative mortality rates were 0.4%, 1.0%, and 3.6% in the low‐grade fatty liver group (solid gray line); 0.5%, 1.3%, and 3.6% in the intermediate‐grade fatty liver group (dotted line); and 0.2%, 0.3%, and 1.0% in the high‐grade fatty liver group (solid black line). (B) Cerebrovascular and cardiovascular diseases. The respective 3‐, 5‐, and 10‐year cumulative mortality rates were 0.1%, 0.6%, and 1.4% in the low‐grade fatty liver group (solid gray line); 0.2%, 0.4%, and 2.1% in the intermediate‐grade fatty liver group (dotted line); and 0.1%, 0.5%, and 0.7% in the high‐grade fatty liver group (solid black line). (C) Benign diseases (excluding cerebrovascular and cardiovascular diseases). The respective 3‐, 5‐, and 10‐year cumulative mortality rates were 0.3%, 0.3%, and 2.3% in the low‐grade fatty liver group (solid gray line); 0.2%, 0.5%, and 1.9% in the intermediate‐grade fatty liver group (dotted line); and 0.4%, 0.6%, and 2.2% in the high‐grade fatty liver group (solid black line).
