Fig. 1.

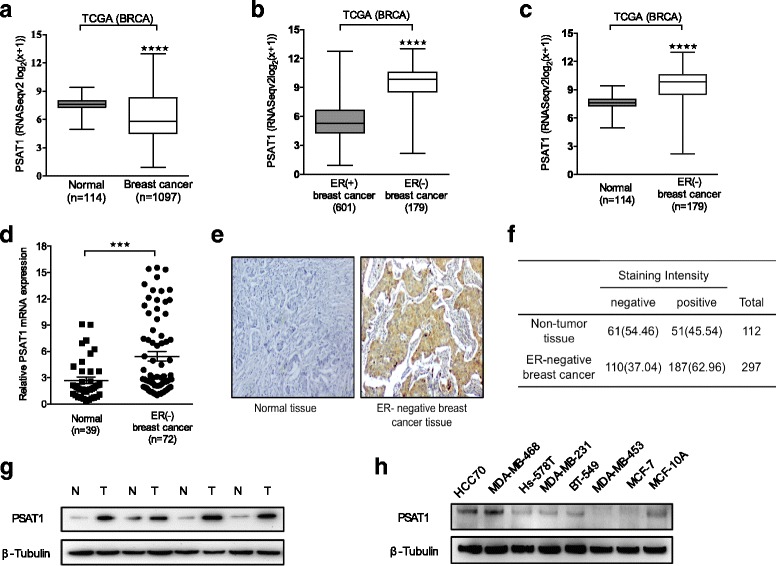
PSAT1 was overexpressed in ER-negative breast cancer specimens and cell lines. a Expression profile of PSAT1 in primary breast cancer tissues (n = 1097) and normal breast tissues (n = 114) (TCGA). b PSAT1 expression levels were higher in ER-negative breast cancer compared with ER-positive breast cancer (TCGA). c Expression of PSAT1 in 170 ER-negative breast cancers and 114 normal breast tissues (TCGA). d Relative expression of PSAT1 in ER-negative breast cancers (n = 72) in comparison with non-tumor normal tissues (n = 39). Data are presented as the fold-change in ER-negative breast cancers relative to normal tissues. e Representative images of PSAT1 immunohistochemical staining. f Table reports the numbers of ER-negative breast cancers versus non-tumor tissues with ‘positive’ or ‘negative’ PSAT1 staining. (Chi-square test is used. P < 0.01). g Western blotting analysis of PSAT1 expression in ER-negative breast cancers and paired normal tissues. The levels of β-Tubulin were used as an internal control. T: ER-negative breast cancer N: normal tissue. h Western blotting for PSAT1 in 7 human breast cancer cell lines and non-transformed MCF-10A. ***P < 0.001, ****P < 0.0001. TCGA = The Cancer Genome Atlas; BRCA = Breast carcinoma
