Fig. 5.

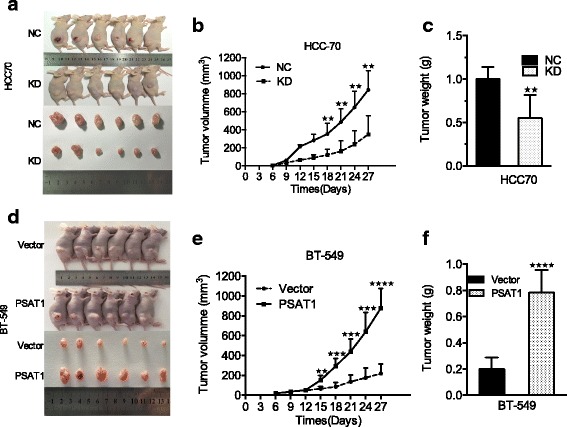
PSAT1 promoted tumor formation in a nude mouse model. a PSAT1-knockdown or control HCC70 cells and (d) PSAT1-overexpression or vector BT-549 cells were injected into the flank of nude mice respectively (upper panel). Tumors were resected from mice 27 days (lower panel). b and e Volume of indicated tumor were shown using time-course line plot. Tumor volume was calculated every 3 days. c and f Tumor weight of xenograft in indicated mice. Data are presented as the mean ± SD. (n = 6). **p < 0.01, ***P < 0.001, ****p < 0.0001
