
Fig. 4.
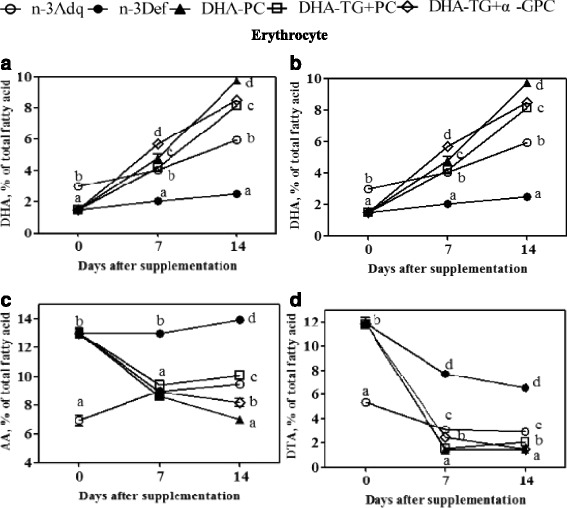
Time course curves of DHA (a), DPA (b), AA(c), DTA(d) in erythrocyte after dietary DHA supplementation from 0 to 14 days. Data at various time points are given as mean percent ± SEM (n = 5 mice per time point). Different letters indicate significant difference at p < 0.05 among all dietary groups after 3 weeks of age