
Fig. 1.
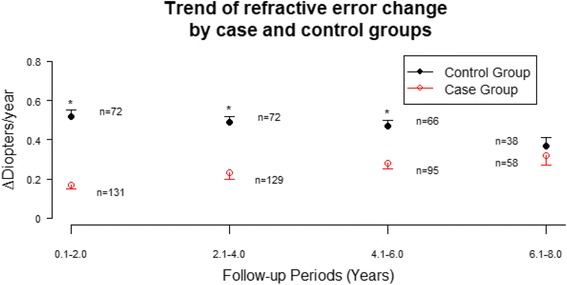
Trend of refractive error change. The trend of refractive error change during year 0 to year 2 for OK and control groups were 0.17 ± 0.02 D and 0.52 ± 0.03 D (mean ± SE), respectfully. The trend of refractive error change during year 2 to year 4 for OK and control groups were 0.23 ± 0.03 D and 0.50 ± 0.03 D (mean ± SE), respectfully. The trend of refractive error change during year 4 to year 6 for OK and control groups were 0.28 ± 0.03 D and 0.47 ± 0.03 D (mean ± SE), respectfully. The trend of refractive error change during year 6 to year 8 for OK and control groups were 0.32 ± 0.05 D and 0.37 ± 0.04 D (mean ± SE), respectfully. Asterisk (*) denotes statistically significant difference between OK and control groups