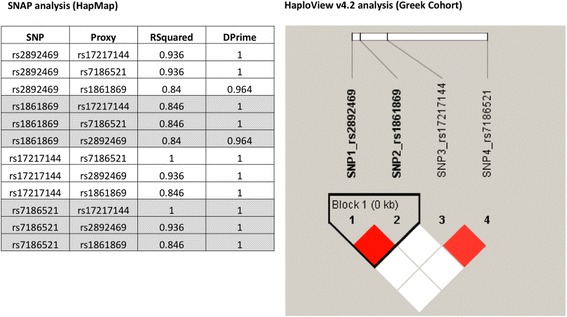
Fig. 2.

Linkage disequilibrium and haplotype block analysis for FTO rs2892469, rs1861869, rs17217144, and rs7186521. Data suggest a haplotype for the FTO genomic variants studied herein. SNAP analysis refers to HapMap datasets, while the HaploView v4.2 analysis corresponds to our Greek cohort. The HaploView 4.2 color scheme denotes the following: white (D′ < 1, LOD < 2) and red (D′ = 1, LOD ≥ 2). rs2892469 and rs1861869 are in perfect LD (D′ = 1, LOD = 23.66, r 2 = 0.884); rs17217144 and rs7186521 exhibit a strong LD (D′ = 0.882, LOD = 10.1, r 2 = 0.738). Block1 is based on confidence intervals, i.e., it was created through 95% of informative comparisons being in “strong LD”
