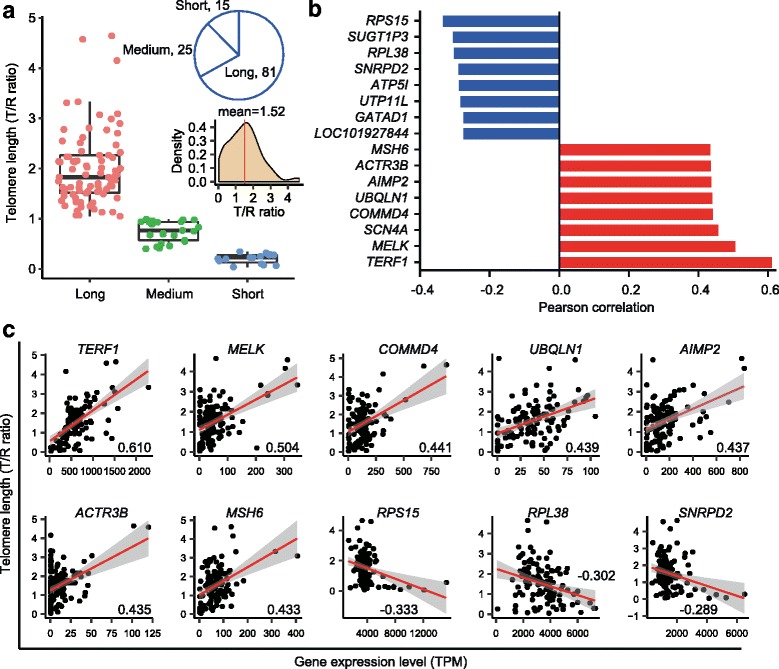
Fig. 2.

Telomere length heterogeneity and candidate genes potentially involved in telomere length maintenance of human embryonic stem cells (hESCs). a hESCs were clustered into three telomere length groups based on T/R ratio by single-cell analysis. We defined the cells with T/R ratio over 1.0 as the “long” telomere group, those with T/R ratio 0.4–1.0 as the “medium” group, and those with T/R ratio under 0.4 as the “short” group. Inset pie figure shows cell number in each telomere length group. Inset density figure indicates distribution of telomere length of hESCs. b Top eight genes with expression patterns remarkably correlated with telomere length (T/R ratio). Red and blue bars show positive and negative correlation with each other. c Scatter plots showing correlation between gene expression level and T/R ratio for selected genes in all samples. The line represents fitted values and shaded band shows 95% confident regions. Correlation value of each gene is shown on the plot
