Fig. 3.

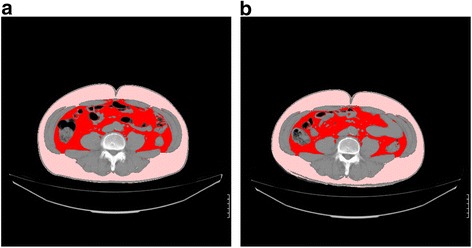
A photographic example of the change in visceral fat area (VFA) of the subjects fed LE for 12 weeks. Red: Visceral fat, Pink: Subcutaneous fat. a: Pre-intake (VFA = 119 cm2), b: Post-intake (VFA = 102 cm2)

A photographic example of the change in visceral fat area (VFA) of the subjects fed LE for 12 weeks. Red: Visceral fat, Pink: Subcutaneous fat. a: Pre-intake (VFA = 119 cm2), b: Post-intake (VFA = 102 cm2)