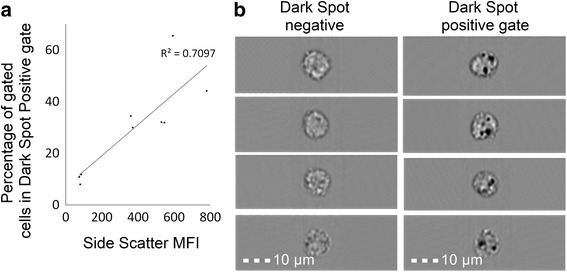
Fig. 5.

Correlation of SSC intensity and dark spots in bright-field images by flow and imaging cytometry. PBMCs from human blood were incubated for 24 h with 0 μg/mL, 5 μg/mL, or 10 μg/mL TiO2 particles in TCM and stained with either CD11c or CD14 antibodies for human monocytes/myeloid cells and analysed with conventional flow or imaging cytometry, respectively. a Correlation between increases in SSC MFI of CD11c+ myeloid cells identified using conventional flow cytometry and the percentages of CD14+ cells bearing dark spots in bright-field measured by imaging cytometry; Pearson correlation p < 0.01, r = 0.8424. b Representative images of cells designated ‘dark spot negative’ or ‘dark spot positive’ by imaging cytometry; scale bar = 10 μm
