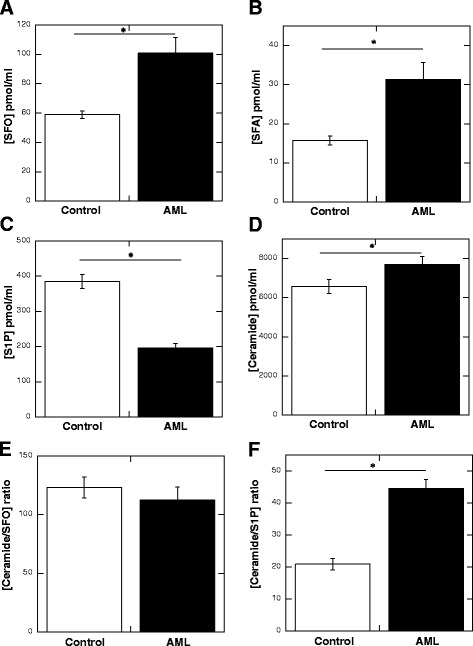
Fig. 1.

Concentration of SFO (panel a), SFA (panel b), S1P (panel c) and ceramide (panel d) in blood plasma samples collected from subject included in control group (n = 51) and AML patients (n = 49). The ratio of ceramide to SFO and ceramide to S1P in control and AML blood plasma samples are shown on panel e and f, respectively
