Fig. 2.

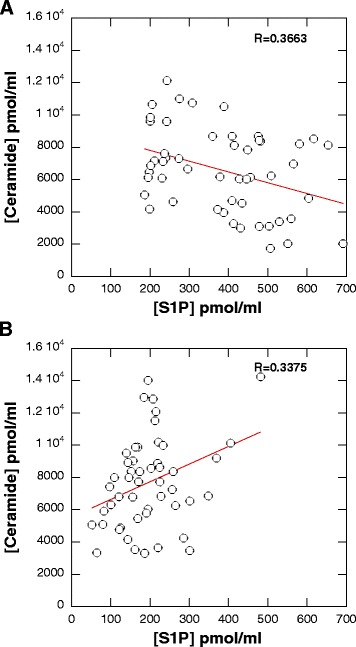
Correlation plot of ceramide versus S1P concentration in blood plasma collected from subjects included in the control group (panel a) and AML patients (panel b). R’ values were calculated using linear curve fit

Correlation plot of ceramide versus S1P concentration in blood plasma collected from subjects included in the control group (panel a) and AML patients (panel b). R’ values were calculated using linear curve fit