
Figure 4.
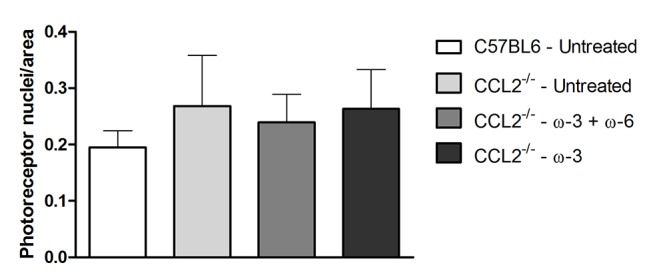
Photoreceptors’ density as estimated by ImageJ among the different groups (photoreceptors nuclei number/retinal area). Data represent the mean±SEM (n=3).
Official websites use .gov
A
.gov website belongs to an official
government organization in the United States.
Secure .gov websites use HTTPS
A lock (
) or https:// means you've safely
connected to the .gov website. Share sensitive
information only on official, secure websites.
Photoreceptors’ density as estimated by ImageJ among the different groups (photoreceptors nuclei number/retinal area). Data represent the mean±SEM (n=3).