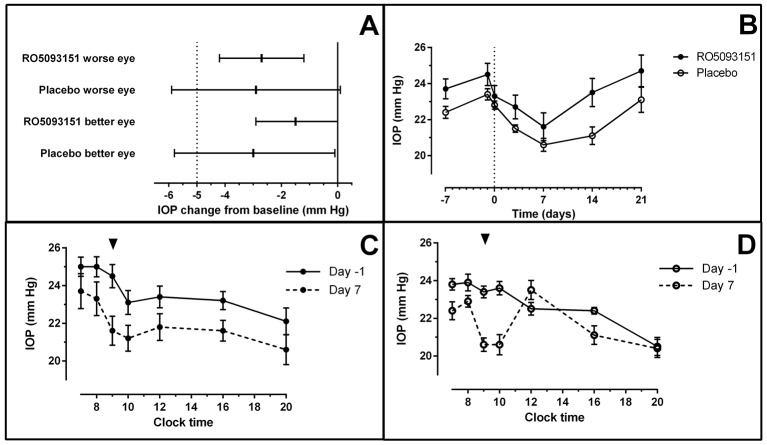
Figure 4.
Effect of RO5093151 and placebo on IOP. (A) Adjusted least square mean change from baseline and 95% CI in IOP from ANCOVA model at 1-hour postdose on day 7 versus time-matched 1-hour postdose on day −1. (B) Mean (±SEM) 1-hour postdose IOP profile for RO5093151 and placebo-treated patients over the study period. (C) Mean (±SEM) IOP time profile for RO5093151-treated patients (worse eye) for days −1 and 7. (D) Mean (±SEM) IOP time profile for placebo-treated patients (worse eye) for days −1 and 7. Arrow indicates time-point of primary endpoint (1-hour postdose); clock time shown for C and D. ANCOVA, analysis of covariance; IOP, intraocular pressure.

