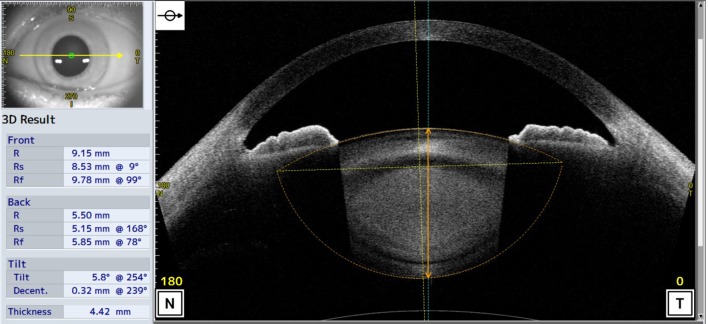
Figure 1.
Optical coherence tomography images obtained from the CASIA2 anterior and posterior lens boundary are automatically drawn (orange dot lines), and their curvatures are calculated by the built-in software. Optic axis of lens (vertical orange dot lines) and vertex normal (vertical blue solid line) are automatically drawn and crystalline lens thickness is also calculated by the built-in software (vertical orange solid line).

