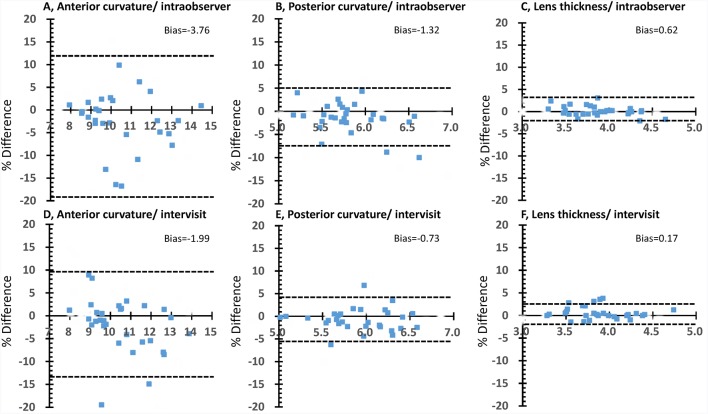
Figure 2.
Bland-Altman plots for intraobserver and intervisit measurements at static condition (±0 D). A–C, Bland-Altman plots of intraobserver measurements. There is no substantial bias between these measurements. The 95% limits of agreement are +11.82% to −19.34% for anterior curvature (A), +4.97% to −7.60% for posterior curvature (B) and +3.33% to −2.09% for lens thickness (C). (D–F) Bland-Altman plots of intervisit measurements. There is no substantial bias between these measurements. The 95% limits of agreement are +9.57% to −13.55% for anterior curvature (D), +4.13% to −5.59% for posterior curvature (E) and +2.40% to −2.05% for lens thickness (F).

