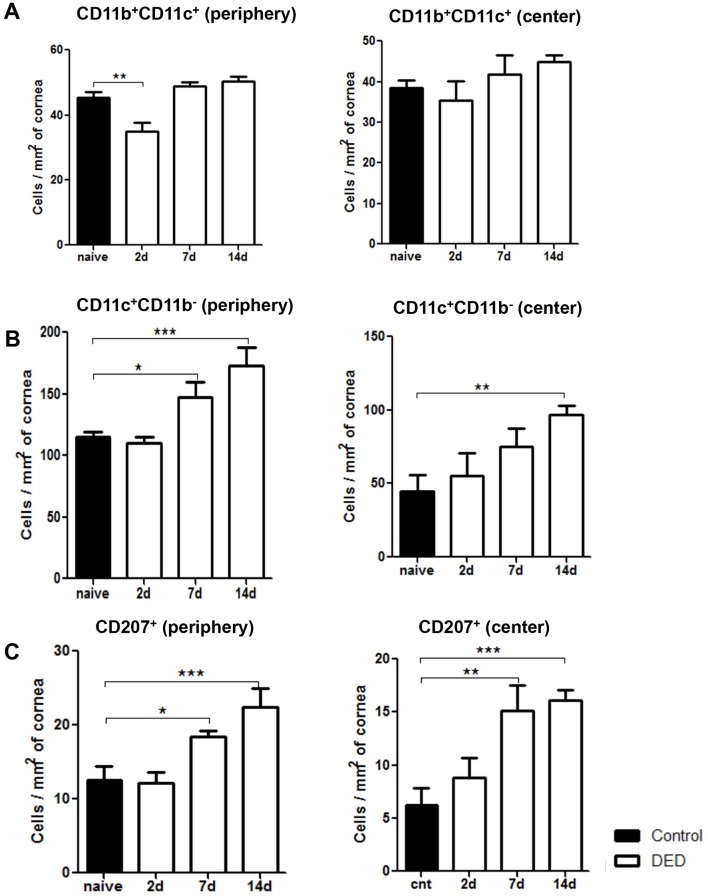
Figure 3.
Frequencies of CD11c+CD11b- DCs and Langerin+ DCs progressively increase in the cornea of mice with dry eye disease (DED). Representative bar charts demonstrating quantitative immunohistochemistry data on the frequencies of (A) CD11b+CD11c+ DCs, (B) CD11c+CD11b- DCs and (C) CD11c+CD207 (Langerin)+ DCs in the periphery and centre of cornea at baseline and on days 2, 7 and 14 after DED induction. Data are presented as the mean±SEM of three or four independent experiments involving three to four corneas per group (*p<0.05, **p<0.01, ***p<0.001).

