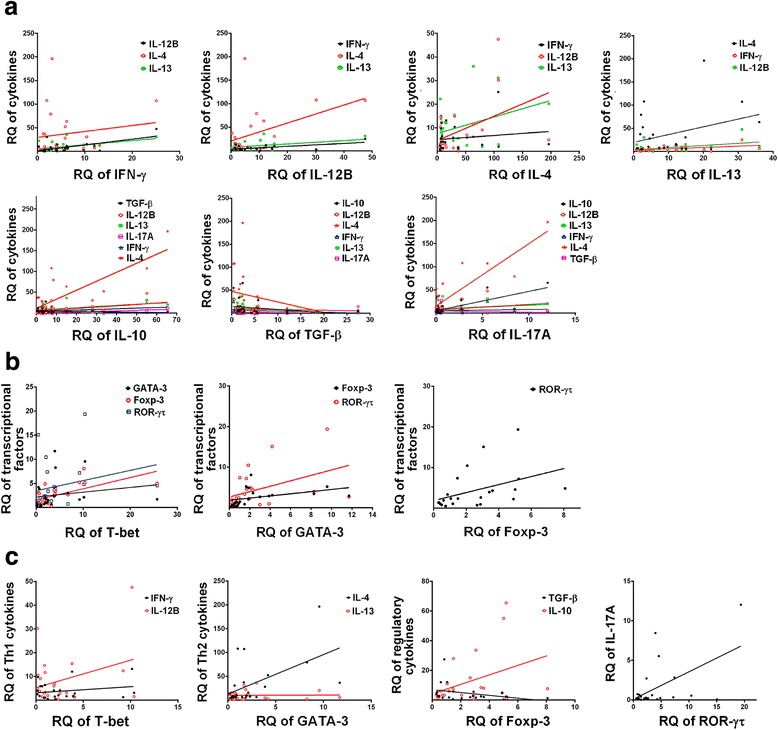
Fig. 3.

Pearson’s correlation analysis between mRNA expressions of Th1/Th2/Th17/Treg type a cytokines, b transcription factors, and c cytokines vs transcription factors in the liver of buffaloes infected with Fasciola gigantica (tested samples, n = 29) by pairwise comparison. Connecting lines illustrate positive (r > 0) and negative (r < 0) correlation indices
