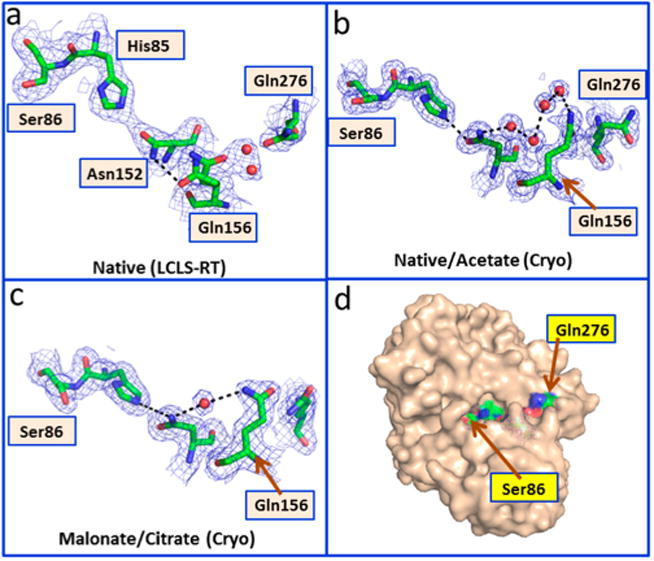
Figure 4.

Conformational changes in the AT at room temperature. The panels show conformational changes in the vicinity of Gln156. All residues are labeled in the room-temperature structure; the other structures are drawn in an analogous orientation. Panel A shows the interactions observed in the XFEL room-temperature structure. Panel B shows the interactions observed in the 100 K structures of the native enzyme and the acetate complex. Panel C shows the interactions observed in the 100 K structures of the malonate and citrate complexes. Panel D shows the surface representation highlighting the pathway. The 2Fo — Fc maps are contoured at 1.0σ
