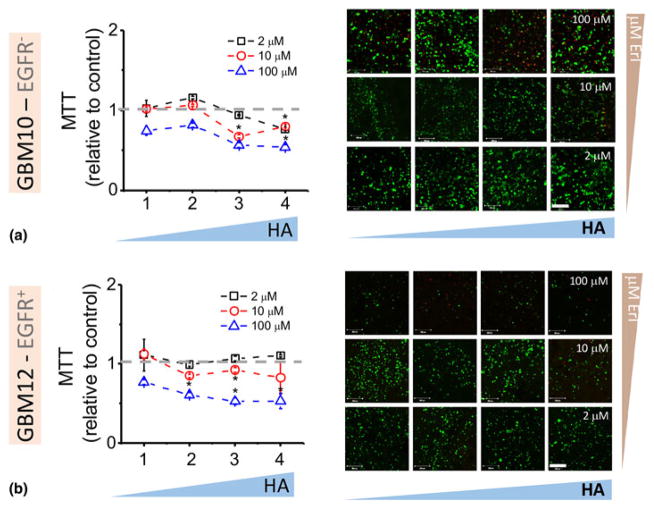
Figure 3.
Metabolic activity (MTT) and cell viability (live/dead images) of GBM10 (a) and GBM12 (b) within GelMA/HAMA hydrogel gradients exposed to first dose of erlotinib. Gradient hydrogels were exposed to single doses of erlotinib of 2 (bottom images), 10 (middle), and 100 μM (top). Scale bar 200 μm.
*P < 0.05 compared with section 1.

