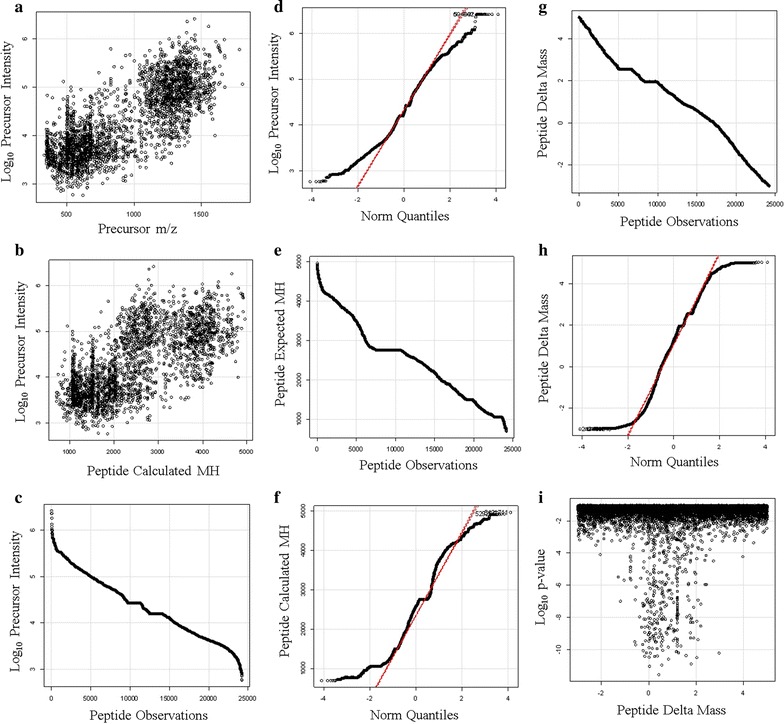
Fig. 10.

The distributions of the endogenous peptides from proteins with three or more independent correlations to the same protein accession by X!TANDEM. Panels a the scatter plot of log10 precursor intensity values versus precursor m/z; b the scatter plot of the log10 distribution of precursor intensity values versus peptide mass [M + H]+; c the sorted distribution of log10 intensity values; d the quantile plot of precursor log10 intensity values; e the sorted distribution of calculated peptide mass [M + H]+; f the quantile plot of peptide [M + H]+; g the sorted distribution of the peptide delta mass; h the quantile plot of the delta mass; i the relationship between delta M + H versus peptide log10 p-value
