
Fig. 5.
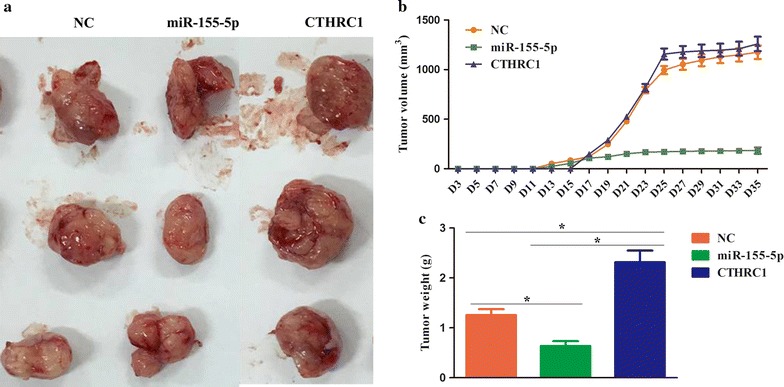
miR-155-5p suppressed tumor growth through CTHRC1 in a nude mouse model. a Representative images of tumors in different groups. b Growth curve of tumor volume from 3 to 35 days. c The tumor weights of each group. * p < 0.05
Official websites use .gov
A
.gov website belongs to an official
government organization in the United States.
Secure .gov websites use HTTPS
A lock (
) or https:// means you've safely
connected to the .gov website. Share sensitive
information only on official, secure websites.
miR-155-5p suppressed tumor growth through CTHRC1 in a nude mouse model. a Representative images of tumors in different groups. b Growth curve of tumor volume from 3 to 35 days. c The tumor weights of each group. * p < 0.05